Introduction
WheatCrispr is an interactive tool for selecting CRISPR single guide RNAs (sgRNAs) in bread wheat. sgRNAs are scored according to predicted on-target activity and off-target potential using models devised by Doench et. al., Nat. Biotech. 2016
WheatCrispr uses the Doench on-target and off-target scores, along with information about the location of off-target hits (coding, intronic, intergenic, etc.) to produce a single overall score for each sgRNA. By default, detailed information is displayed for the ten highest scoring sgRNAs to facilitate rapid identification of the most likely candidate sequences. An interactive interface allows the user to browse all other sgRNAs if desired.
Polyploidy presents a unique challenge to sgRNA selection as the high similarity between homoeologues results in a greatly increased chance of sgRNAs targetting multiple homoeologues. Depending on the nature of the experiment this may be desired or it may not. WheatCrispr supports two overall scoring schemes, one that favors sgRNAs that target only the queried gene by treating off-target hits in homoeologues as it would any other gene, and a second that targets all homoeologous genes by rewarding off-target activity in homoeologues.
Contact
For questions or comments contact us at Sateesh.Kagale(at)nrc.gc.ca and Dustin.Cram(at)nrc.gc.ca
Cite
Cram D, Kulkarni M, Buchwaldt M, Rajagopalan N, Bhowmik P, Rozwadowski K, Parkin IA, Sharpe AG, Kagale S. WheatCRISPR: a web-based guide RNA design tool for CRISPR/Cas9-mediated genome editing in wheat. BMC Plant Biology. 2019 Dec;19:1-8.
Inputs
Select an Input Method
Select a Gene
Paste a Sequence
Select Ontarget Set
Select homoeologue scoring system
If this box is left blank then the overall score will be calculated using a method that treats homoeologues like any other gene, preferring gRNAs that are unique to the selected gene only.
If this box is checked then the scoring scheme is adjusted to reward offtarget hits in homoeologues while still penalizing all other offtarget hits.
Activity scores
A brief explanation of the on-target and off-target activity scores is provided here. For more information about the RS2 and CFD scores, please refer to Doench et. al., Nat. Biotech. 2016
RS2 (on-target) score
The RS2 (ruleset 2) scores measures the predicted cutting efficiency of the gRNA. This is a function only of the gRNA sequence itself plus a small flanking region on either side. The score ranges from 0 (no predicted activity) to 1.0 (maximum activity).
CFD (off-target) scores
The CFD (cutting frequency determination) score measures the predicted cutting efficiency of an off-target sequence relative to the on-target sequence. This score ranges from 0 (no predicted activity), to 1.0 (full activity, ie. equal activity to the on-target site). An off-target site with identical sequence to the on-target site will therefore always have a score of 1.0.
Overall score
The overall score is a weighted average of the RS2 and maximum CFD scores. This score is not described by Doench _et. al._, it is specific to WheatCrispr. __Note__: this scoring function is not based on any empirical evidence that suggests it provides the best possible balance between on-target and off-target activity. It is simply an intuitive estimate designed to help accelerate the process of finding effective gRNAs. Users are strongly encouraged to consider the individual RS2 and CFD scores, and other factors, before selecting a gRNA. The exact function used when not targetting all homoeologues (the default mode) is:
`0.5(text{rs2}) + 1 - (0.5( 0.7(max(text{cfd_coding}, text{cfd_promoter})) + 0.2(max(text{cfd_other_genic})) + 0.1(max(text{cfd_intergenic})) )`
and when targetting homoeologues is enabled:
`0.33(text{rs2}) + (1 - (0.33( 0.7(max(text{cfd_coding}, text{cfd_promoter})) + 0.2(max(text{cfd_other_genic})) + 0.1(max(text{cfd_intergenic})) ))) + 0.34(mean(text{cfd_hmlgs}))`
Outputs
gRNAs Table

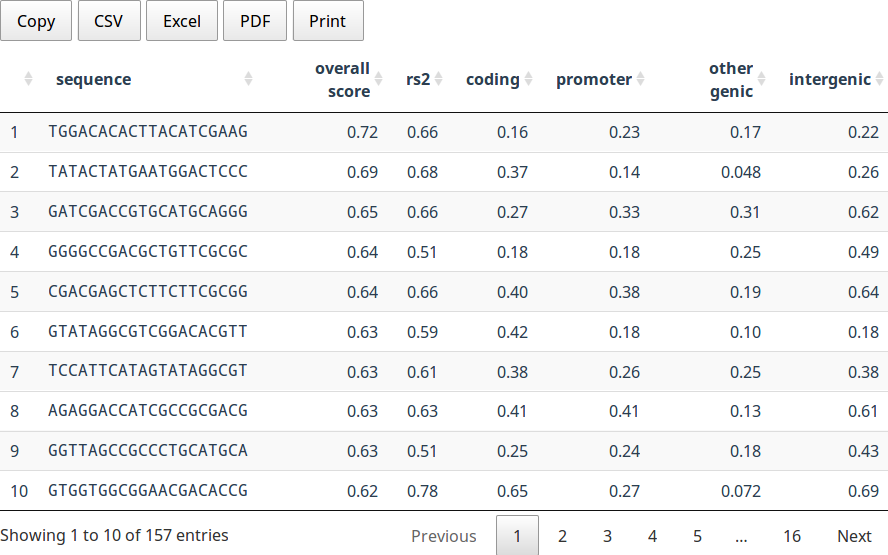
This table summarizes all gRNAs for the selected gene. The columns are:
- Sequence
- The protospacer sequence
- Overall Score
- The WheatCrispr overall score, as defined above
- RS2
- The Doench RS2 score, as defined above
- coding
- The maximum offtarget CFD score in a coding region
- promoter
- The maximum offtarget CFD score in a promoter region (defined as 2kbp upstream of a gene)
- other genic
- The maximum offtarget CFD score in other genic regions (introns and UTR)
- intergenic
- The maxmimum offtarget CFD score in the intergenic regions
Note that when the "Target Homoeologue" option is enabled that the maximum CFD scores will be adjusted to show the maximum CFD score outside of a homoeologue. That is, the table always shows the "worst" CFD score.
Clicking on a row while open a new table below that displays the set of all offtarget hits for the selected gRNA.
The table can be sorted by any column
gRNAs Plot

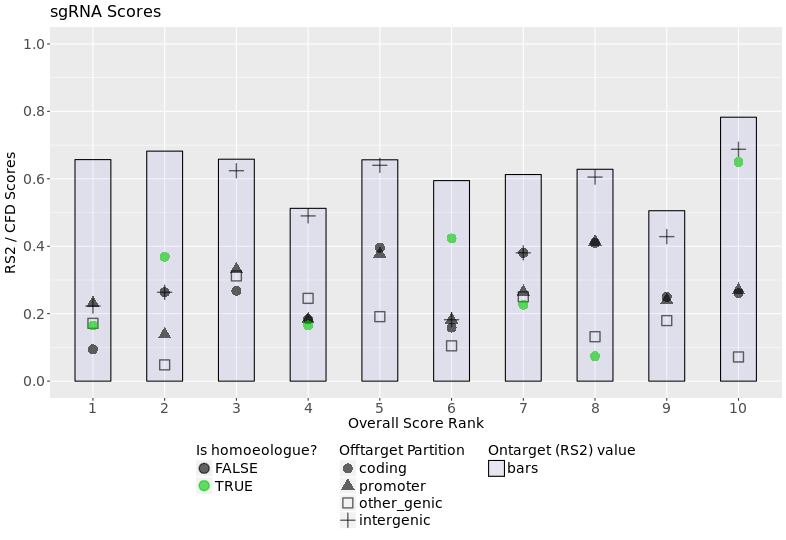
This plot displays a visualization of the scores found in the table, plus the score for any offtargets hits to homoeologues. The blue-gray bars shows the RS2 (ontarget) score, the black points indicate the worst CFD scores for each region (coding, promoter, other genic, intergenic), and the green points, if any, show the CFD scores for homoeologues.
Offtargets Table

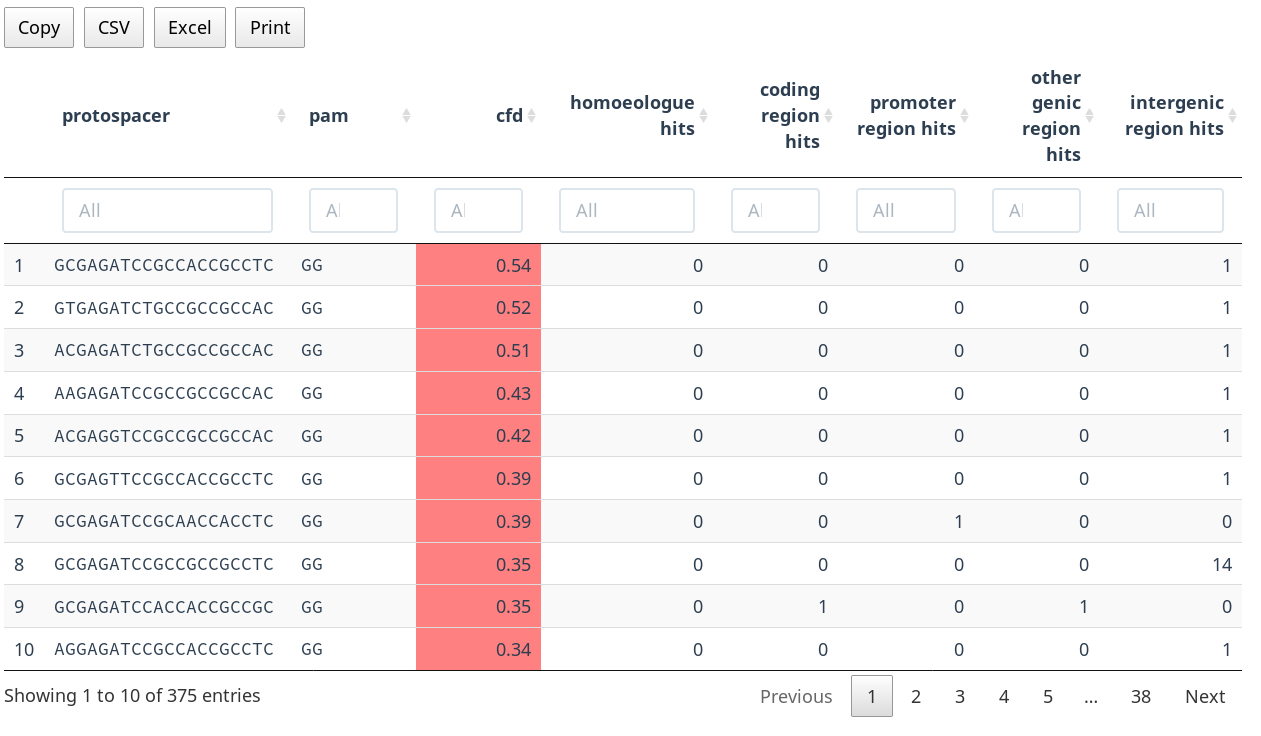
The offtarget table displays all offtarget hits for the selected gRNA. The columns are:
- protospacer
- Sequence of the 20bp protospacer region
- pam
- Sequence of the 3bp PAM region
- partition
- The genomic region, one of "coding", "promoter", "other genic" (UTRs and introns), and "intergenic"
- mismatches
- Number of mismatches to the gRNA
- cfd
- CFD score of the gRNA - offtarget site pair
- gene
- The gene in which this offtarget hits occurs (applicable only to coding and promoter regions
Gene Plot

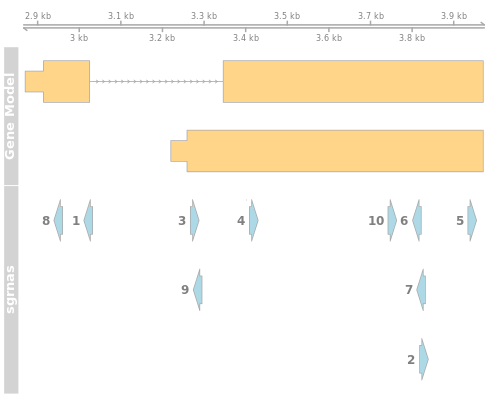
The gene plot displays the physical location of the gRNAs against the gene models. Each row in the gene model represents an isoform of the gene. The gray lines are introns and yellow bars exons. The thinner bars indicate UTRs.